


1
2
3
4
5
6
7
8
9
10
11
12
13
14
15
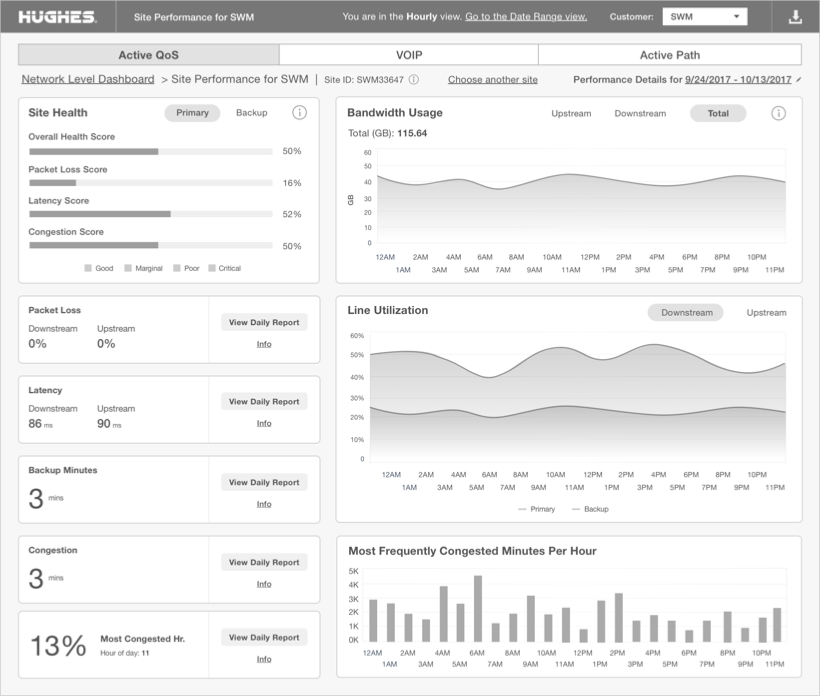
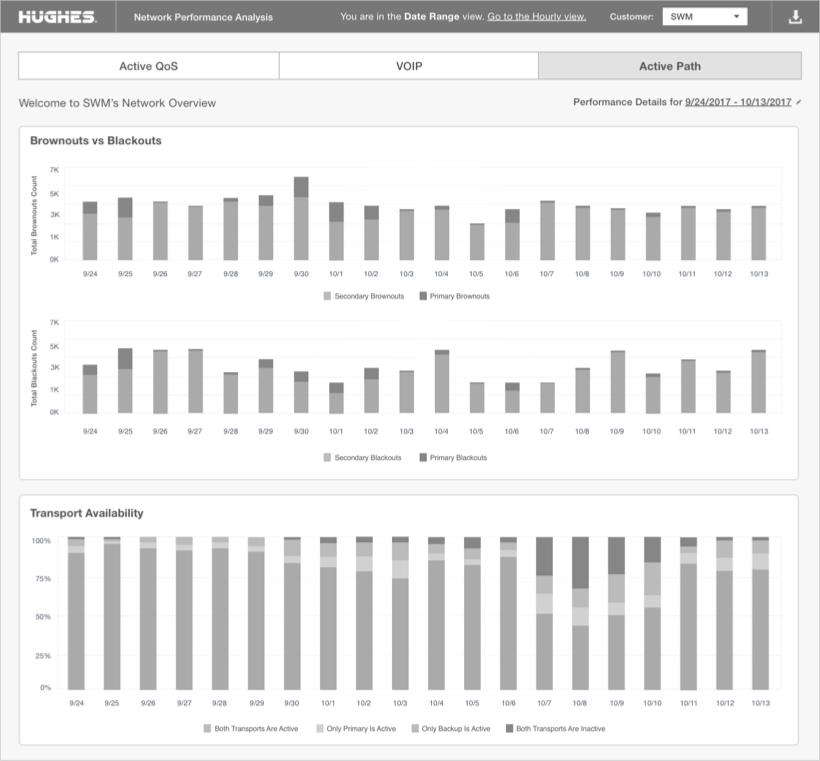
While working with Hughes, the task at hand was to create layouts for Network and Site Level Performance dashboards to create an app that would be used internally within the organization to monitor performance over time and address any issues.
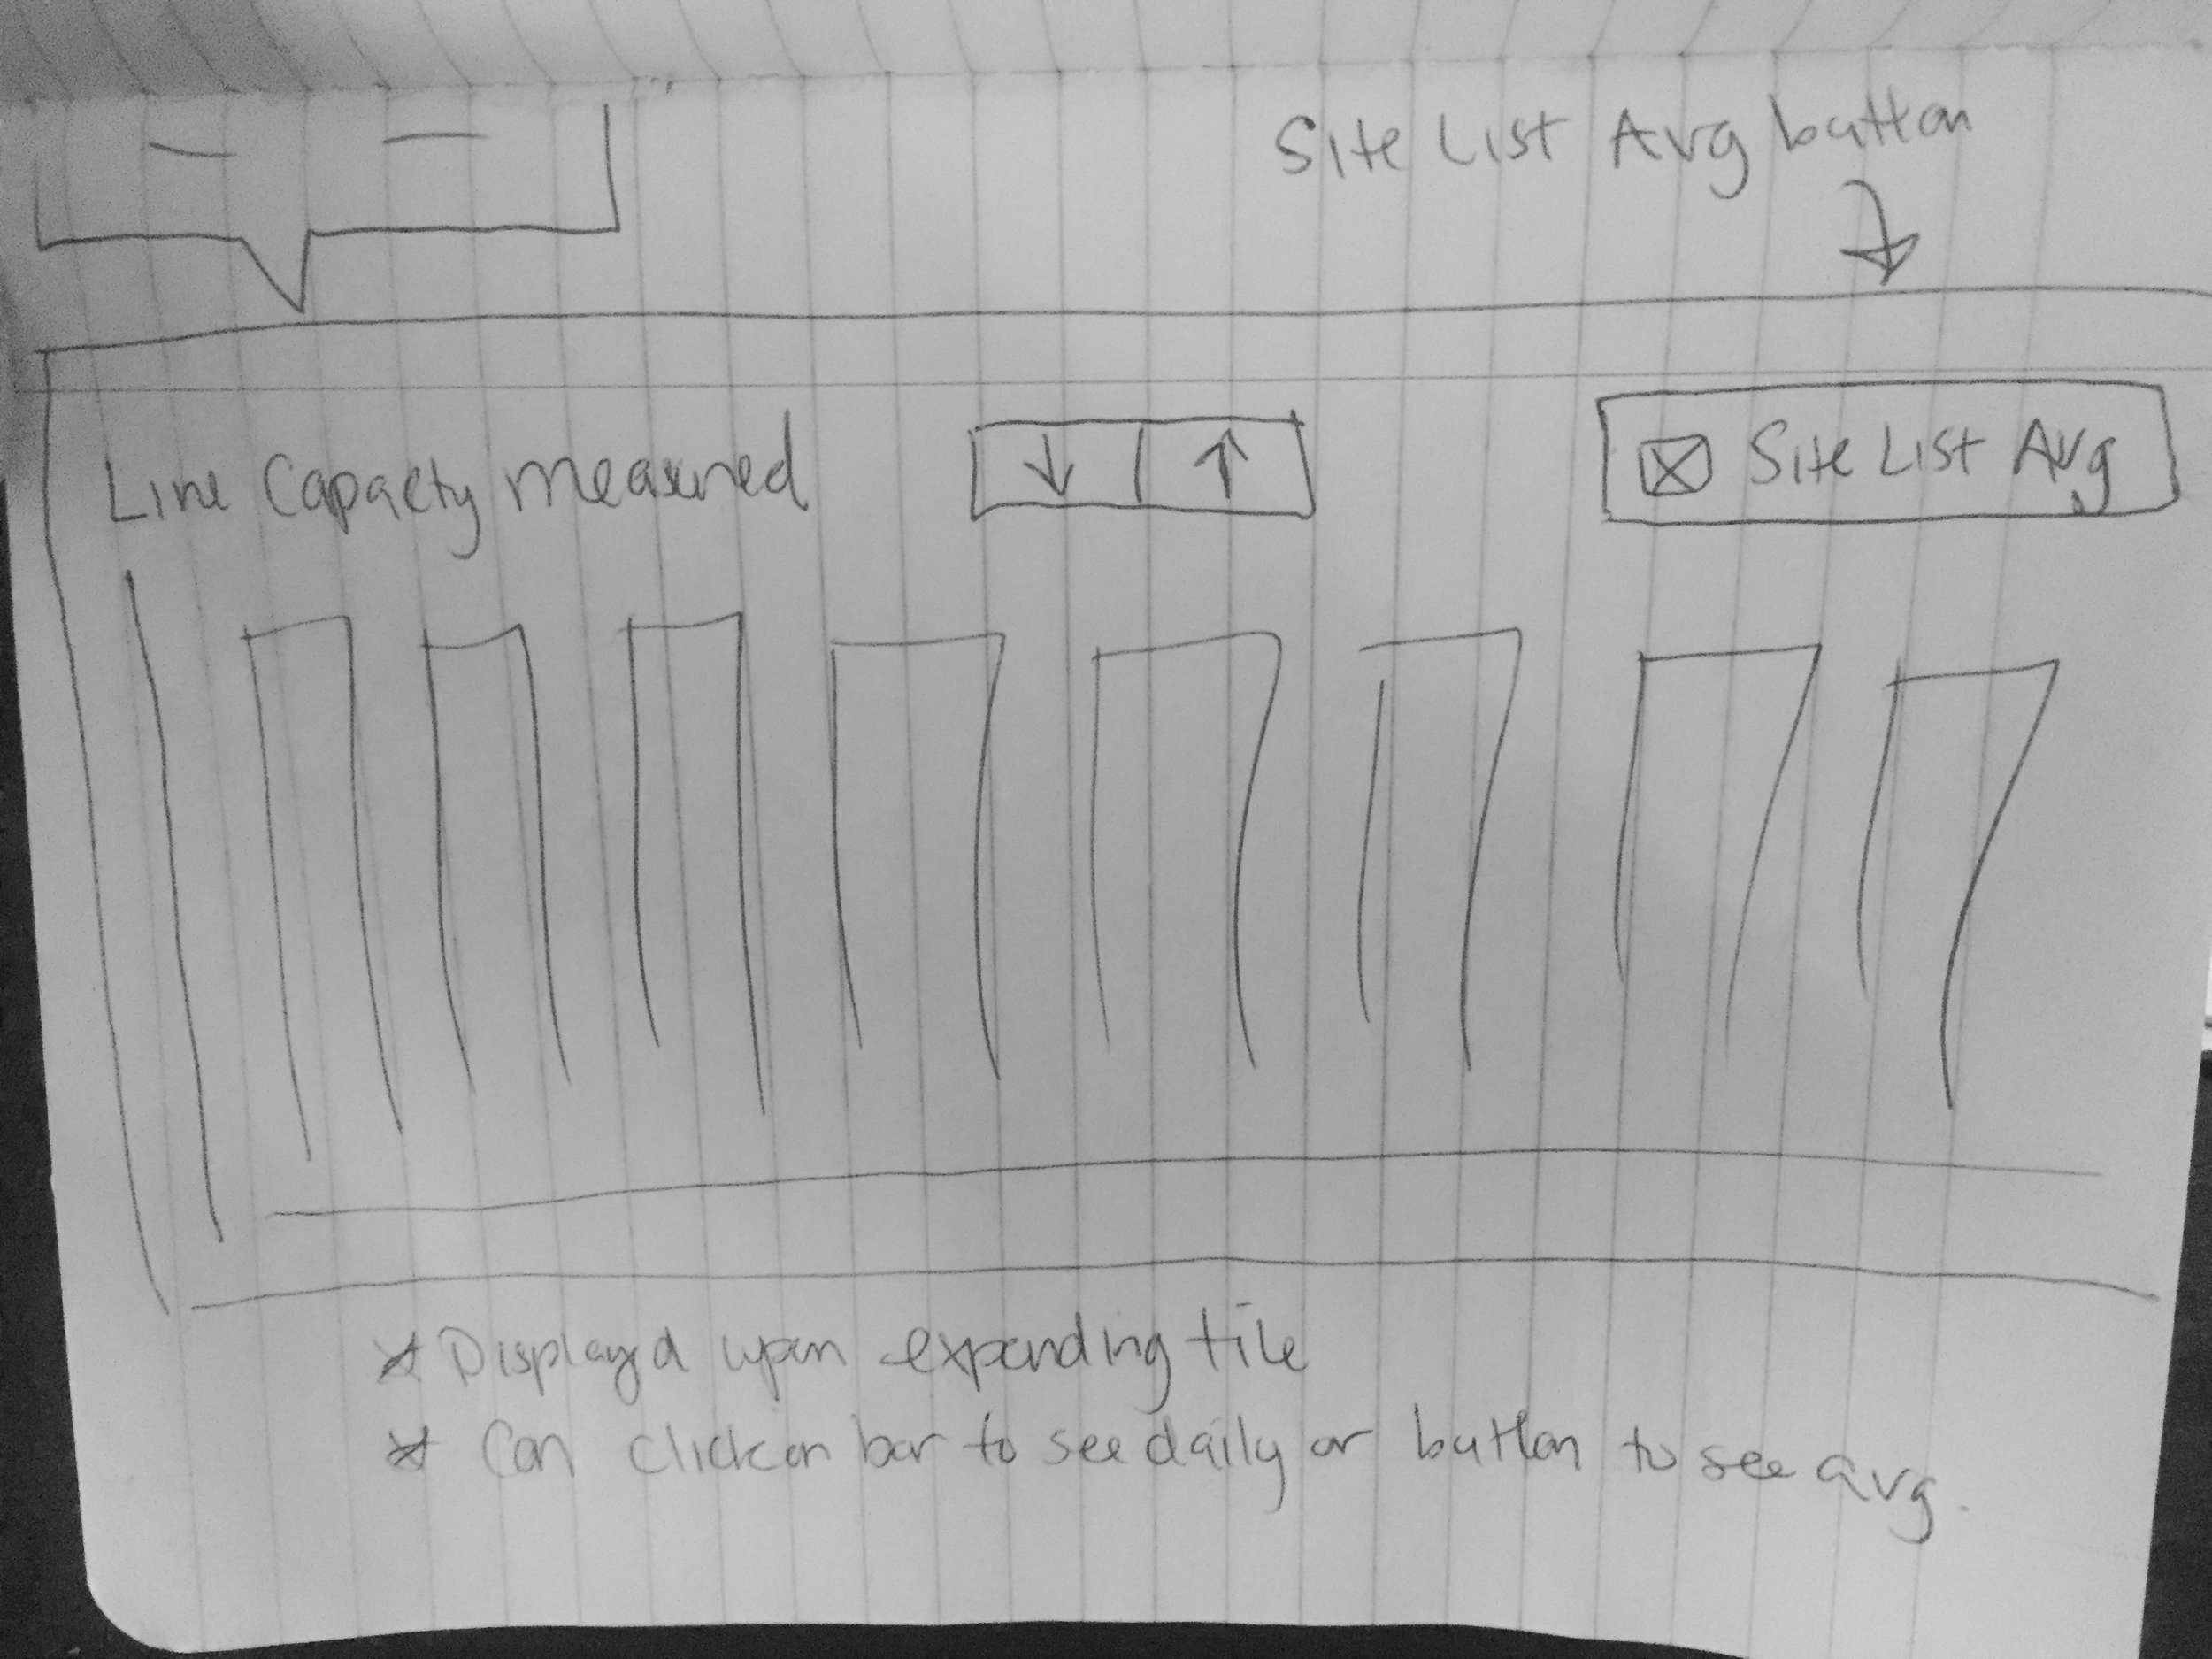
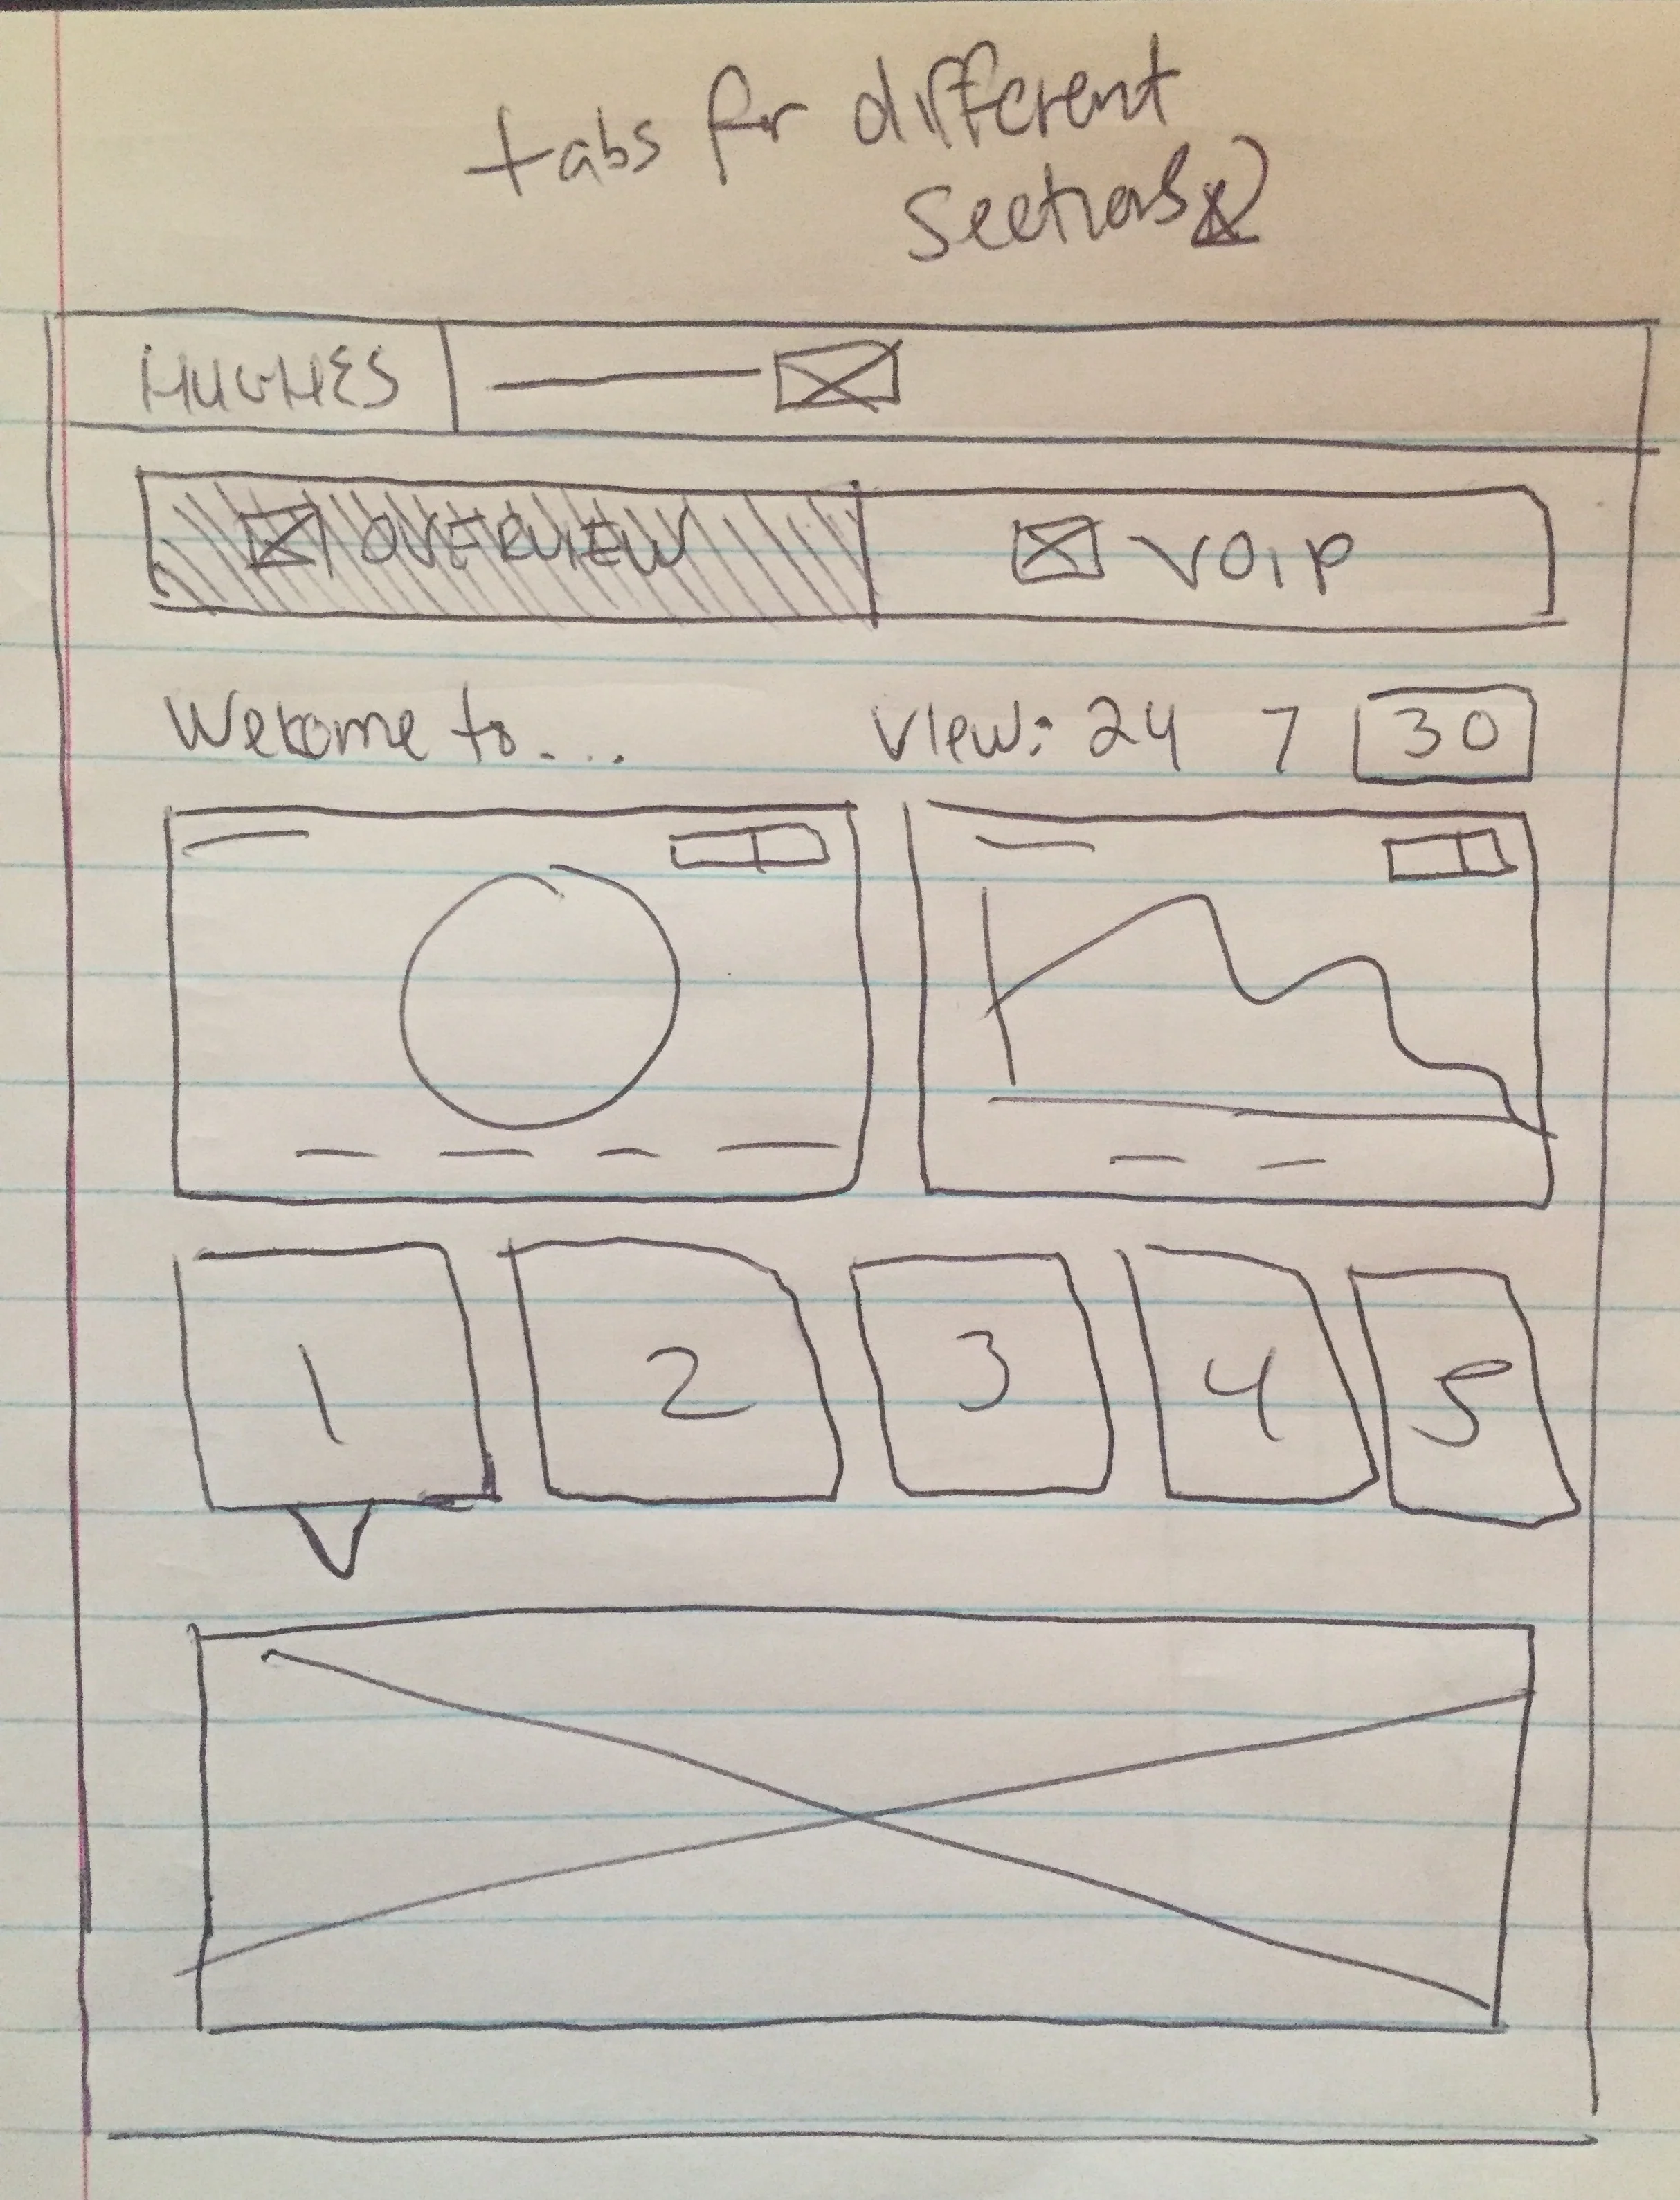
After several onsite meetings with the stakeholders, I began to iterate on high-level sketches and shared them with the Project Manager and Dev Team to determine I was on the right path. They are shared below in order to better illustrate my thought and design processes. We collaborated on brainstorm sessions and refining those early sketches prior to beginning the wireframe process.
Limitations within the MicroStrategy platform were taken into consideration throughout the design process. While the look and feel had mostly been determined in a prior mockup iteration phase based on existing branding, the main challenge was to take these complex networks and design a new experience for them in a streamlined, intuitive way so the client could easily identify problem areas and address any changes that needed to be made as quickly as possible.
Several navigation ideas were explored early on as shown in the sketches below. There were several different areas of charts and graphs to take into consideration and had to be designed for accordingly. Determining the best use of progressive disclosure was paramount with limited real estate and limitations within the software itself. My ideas were tested alongside the developer and modified as needed.
Once the wireframes had been refined and approved internally, the developers began building them within MicroStrategy. Any complications that arose in development were promptly addressed by both the Project Manager and myself. Due to a tight timeline and the fact that the look and feel had been previously decided upon, full-color mockups were not created and we went directly into the production phase.